Star formation Rate and Active Galactic Nuclei Power
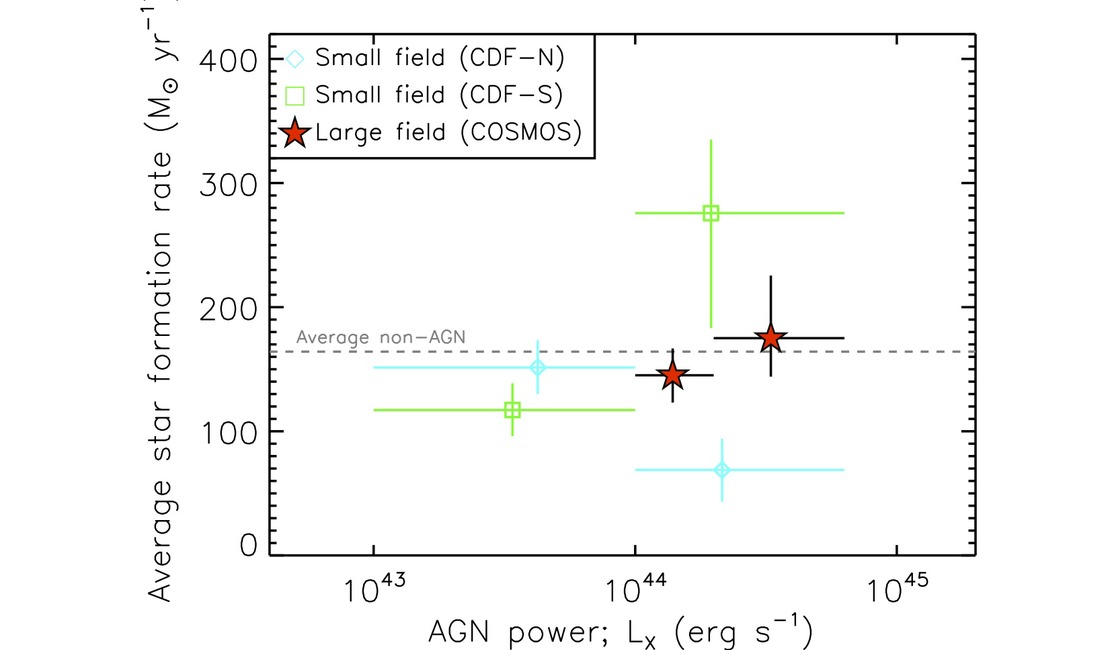
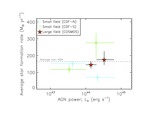
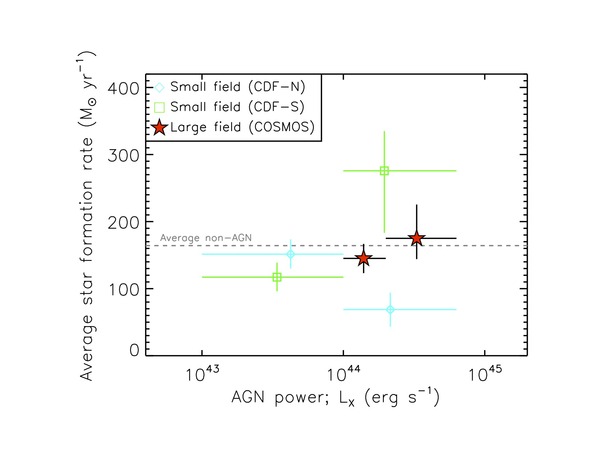
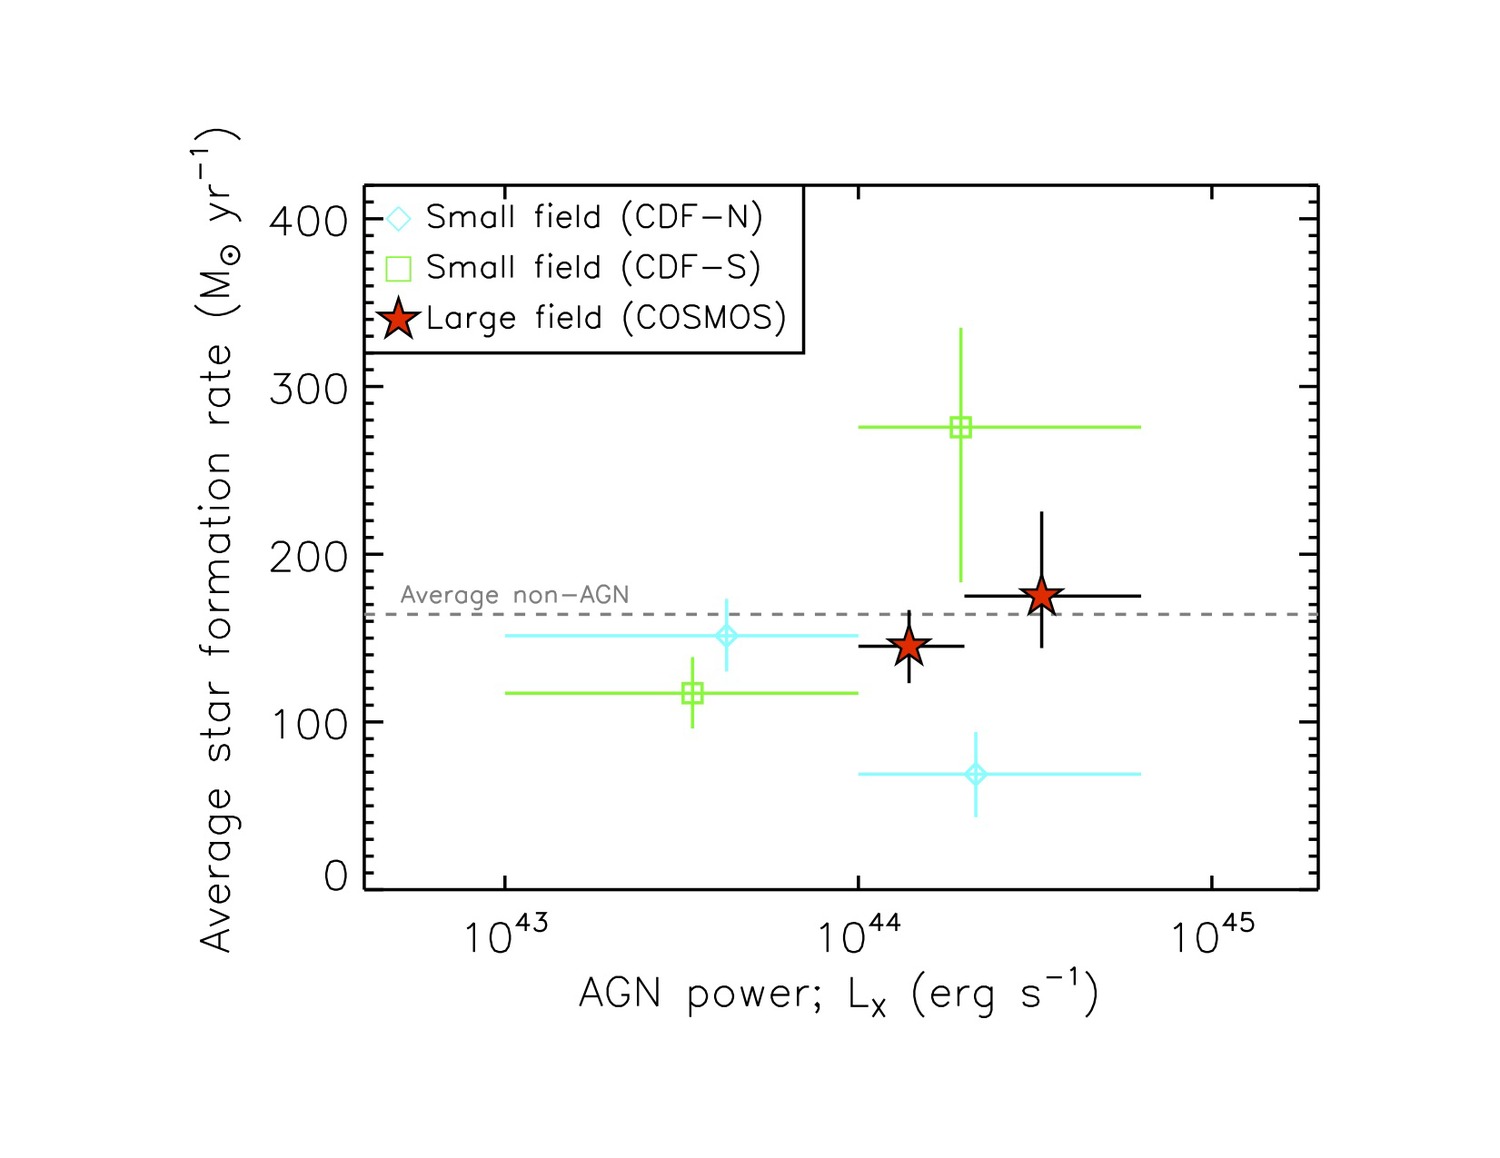
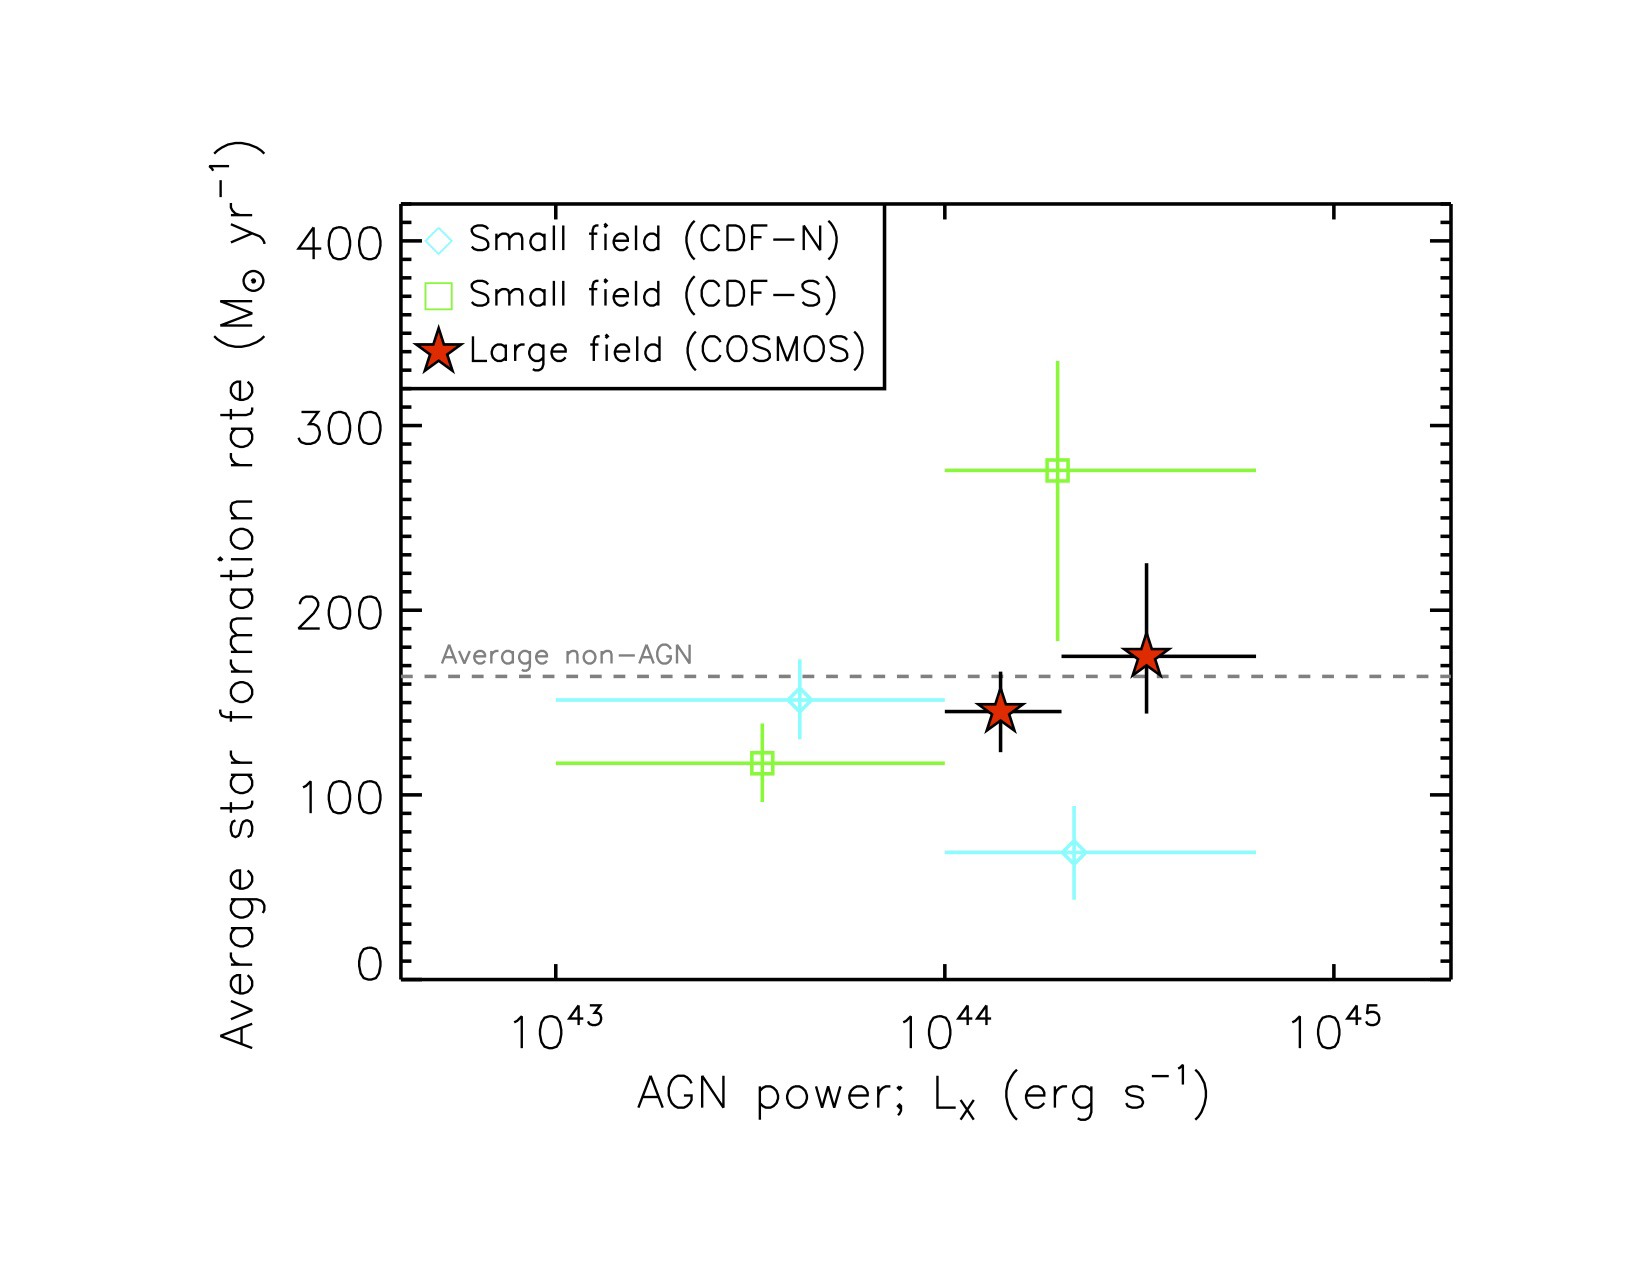
This graph shows how the average rate of star formation for three different samples of galaxies varies as a function of the power of the active galactic nuclei (AGN) hosted at their centers. The star formation rate of a galaxy (expressed in solar masses per year) is inferred from its brightness in the far-infrared and sub-millimetre portions of the electromagnetic spectrum, as measured using ESA's Herschel Space Observatory; on the other hand, the power of the AGN is estimated from the X-ray brightness (L_X) as observed with NASA's Chandra X-ray Observatory.
The graph shows the results based on observations of three different fields in the sky: the Chandra Deep Field North (CDF-N, shown with cyan diamonds) and the Chandra Deep Field South (CDF-S, shown with green squares), which contain several dozens of AGN-hosting galaxies each, and the much larger COSMOS field (shown with red stars), which contains several hundreds of AGN-hosting galaxies. The data points shown in the graph indicate average quantities and have been obtained by stacking the signal from several galaxies together.
The graph clearly shows different results coming from the analysis of different patches of the sky. The data based on observations of the Chandra Deep Field North seem to show that the most powerful AGN have lower star formation rates; however, the same result does not emerge from the analysis of the other two fields.
Overall, the average star formation rate of galaxies that host very powerful AGN is not different from that of galaxies hosting less powerful AGN. In fact, the star formation rates that are measured in these AGN-hosting galaxies are even consistent with those of comparable galaxies that do not display any ongoing AGN activity, as indicated by the grey dashed horizontal line.
The graph indicates that no clear signature of AGN suppressing star formation in their host galaxies can be extracted from the data with this type of analysis. This does not, however, exclude that AGN activity may have contributed to suppress star formation in galaxies. A possible explanation is that this effect does not show up in most of the data because it was a short-lived phenomenon, and it would be extremely difficult to find a signature of such an effect in a large survey of galaxies, because it may be washed out when looking at average properties.
Image Details
- Date
- February 13, 2013
- ID
- nhsc2013-006b
- Type
- Chart
- Credit
- Christopher Harrison, University of Durham, UK


